
Not a Crash, a Shift: The Fall 2026 Housing Market in Orange, Sussex & Passaic Counties

Orange County, NY · Sussex & Passaic Counties, NJ · Data through October 2026
"So, how's the market?" It's the question I hear at the grocery store, the gym, and every casual get together. Here's the honest answer for fall 2026: the market is still healthy, but it has shifted. Buyers have more options, more time to decide and more room to negotiate. Sellers who price correctly are still selling, often at or above asking. Sellers who price on last spring's optimism are sitting, cutting their price, or watching their listing expire.
The charts below track five measures across our three counties from 2020 through October 2026. Together they tell a clear story.
Prices peaked in July, then cooled faster than usual
The average sales price hit roughly $582,000 in July 2026, the highest point on our chart and about $60,000 above July 2025. By October it had slipped to about $516,000, a drop of roughly 11% in three months.
Some fall softening is normal, but this was steeper than usual. Last year, prices held steady in the $530,000s from August through October. October 2026 is the first month this year that came in below the same month in 2025.
One month doesn't make a trend, and averages can swing with the mix of homes that close. But the direction is hard to miss: buyers are pushing back on top-dollar pricing.

More homes are hitting the market, but sales aren't keeping up
Since April, new listings have outpaced 2023, 2024 and 2025 every single month. October brought about 1,050 new listings, roughly 15–20% more than the past two Octobers and the most for that month since 2021.
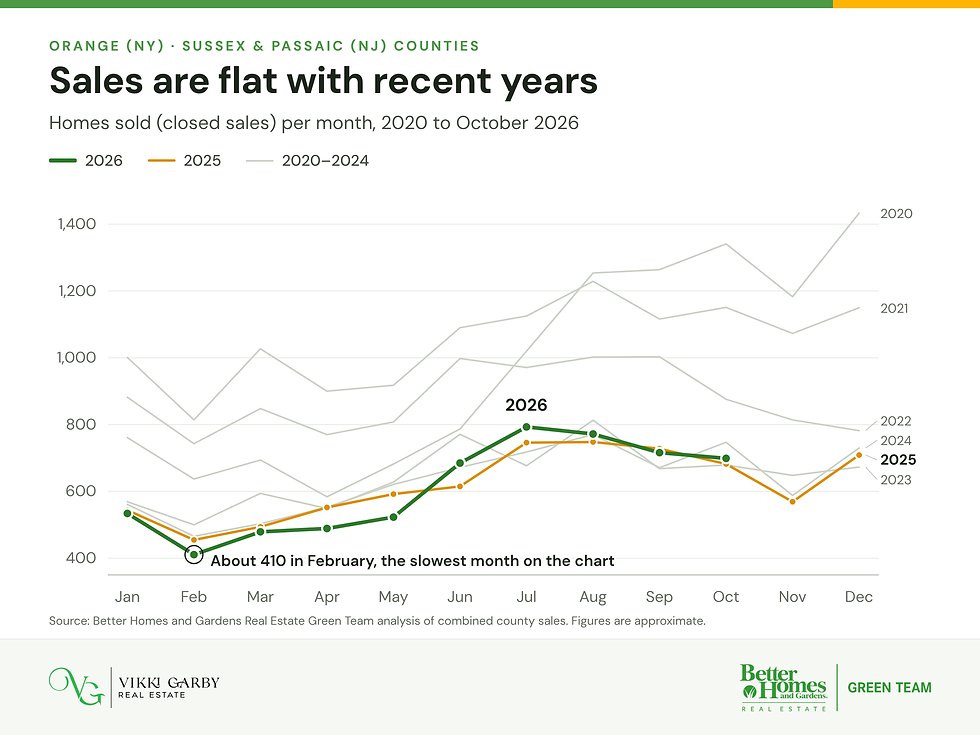
The number of homes actually selling tells a different story. Closings are essentially flat with the last two years. This spring was the slowest on our chart: about 410 sales in February and fewer than 525 every month through May. Summer and fall caught up to 2025 levels, around 700–790 sales a month.
More homes for sale plus the same number of buyers means one thing: more choices for buyers and more competition for sellers.

Homes are taking longer to sell, and offers are softening
In October, the average home sat for about 48 days, the longest October since 2020 and up from roughly 45 days last year. This May averaged about 47 days, versus 37–43 days in every May from 2021 to 2025. Well-priced homes still moved quickly in early summer (about 38 days in June), but the pace has slowed since.

The sold-to-ask ratio shows the same cooling. It peaked near 103% in June and slid to about 100.9% in October, below October 2023 (about 103%) and October 2024 (about 102%).
A ratio still above 100% sounds strong, but here's the catch. Most market reports measure the sale price against the final list price, after any reductions. A home that started too high, cut its price twice, then sold "at asking" still counts as 100%. The ratio tells you that correctly priced homes sell. It doesn't show what overpriced homes gave up along the way.

What the charts don't show: price cuts and expired listings
On the ground, we're seeing far more price reductions in 2026 than in any of the past several years. We're also seeing more expired listings: homes that came off the market unsold because the owner wasn't willing to adjust.
The pattern is familiar. A home lists high, hoping to "test the market." The first few weeks pass without strong offers. As days on market climb, buyers start to wonder what's wrong with it. The seller cuts the price, often more than once, and frequently ends up selling for less than if it had been priced right from day one. Or it doesn't sell at all.
In today's market, the first two to three weeks matter most. That's when a listing gets its biggest wave of attention. Missing that window is expensive.
What this means for buyers
If you sat out the bidding wars of the past few years, this is a very different environment.
More options. With new listings up 15–20% over recent falls, you can compare homes instead of grabbing the first one that fits.
More time. At nearly seven weeks on market on average, you can often see a home twice, bring family through and think it over before writing an offer.
More room to negotiate. Homes that have sat 30+ days or already had a price cut are prime candidates. Repairs, closing-cost credits and price are all on the table again.
But don't assume every home is a bargain. Move-in-ready, well-priced homes still attract multiple offers. Get pre-approved and be ready to act when the right one appears.
What this means for sellers
There are still plenty of buyers out there. Homes priced right are selling for about 101% of asking. The difference now is that buyers have choices, and they're using them.
Price for today's market, not last spring's. That July sale down the street happened in a different market. Recent comps and current competition matter more.
Win the first three weeks. Launch with strong photos, smart prep and a price that generates showings right away.
Watch the competition. With more listings out there, buyers are comparing your home to every other one in the price range.
Have an adjustment plan before you list. Agree with your agent on a review point. If there are no serious offers after a few weeks, a timely adjustment beats a slow slide toward an expired listing.
The bottom line
This isn't a crash. It's a market finding its balance after several years of frenzy. Prices are well above where they were a few years ago, and good homes are still selling. But the leverage has shifted toward buyers, and the margin for error on pricing has disappeared.
Thinking about buying or selling in Orange, Sussex or Passaic County? Reach out to me, Vikki Garby, at Better Homes and Gardens Real Estate Green Team. I’ll walk you through what’s happening in your town and your price range, not just the averages.
Call or text: (201) 213-9818
Email: vikki.garby@gmail.com
Website: vikkigarbyre.com
Source: Better Homes and Gardens Real Estate Green Team analysis of combined Orange (NY), Sussex (NJ) and Passaic (NJ) county sales, January 2020 through October 2026. Figures are approximate.


Comments